Le Infezioni in Medicina, n. 3, 386-392, 2021
doi: 10.53854/liim-2903-9
ORIGINAL ARTICLES
Can a quantitative assessment of SARS-CoV-2 PCR predict degree of severity and outcomes in critical care patients with COVID-19?
Rosalind Stonham1, Chantelle Monck2, Laurence Orchard1, Laurence Baker1, Nusreen Ahmad-Saeed2, Simon Friar2, Buddhini Samaraweera2,3, Adhyana Mahanama2,3, Emanuela Pelosi2,4, Eleri Wilson-Davies2, Ahilanandan Dushianthan1,4,6, Kordo Saeed 4,5
1General Intensive Care Unit, University Hospitals Southampton NHS Foundation Trust, Southampton, UK;
2Southampton Specialist Virology Centre, University Hospital Southampton NHS Foundation Trust, Southampton, UK;
3Ministry of Health, Sri-Lanka;
4Faculty of Medicine, University of Southampton, Southampton, UK;
5Microbiology Innovation and Research Unit (MIRU), Department of Microbiology, University Hospital Southampton NHS Foundation Trust, Southampton, UK;
6NIHR Southampton Clinical Research Facility and NIHR Southampton Biomedical Research Centre, University Hospital Southampton / University of Southampton, Southampton, UK
Article received 1 July, 2021; accepted 4 August, 2021
Corresponding author
Kordo Saeed
E-mail: kordosaeed@nhs.net
SummaRY
Real-Time polymerase chain reaction (qPCR) is the gold standard diagnostic method for severe acute respiratory syndrome coronavirus 2 (SARS-CoV-2) infection. Cycle threshold (Ct) is defined as the number of heating and cooling cycles required during the PCR process. Ct-values are inversely proportional to the amount of target nucleic acid in a sample. Our aim, in this retrospective study, was to determine the impact of serial SARS-CoV-2 qPCR Ct-values on: mortality, need for mechanical ventilation (MV) and development of acute kidney injury (AKI) in patients admitted to the intensive care unit (ICU) with COVID-19. Ct values were evaluated during the time points from pre-ICU admission to week 1, week 2 and week 3 during ICU stay; impact on mortality, need for MV and AKI was determined.
There was a continuous increment in Ct-values over the ICU stay from 1st week through to 3rd week. Although not significant, lower ICU 1st week Ct-values were associated with Black ethnicity, increased need for MV and mortality. However, patients who had developed AKI at any stage of their illness had significantly lower Ct-values compared to those with normal renal function. When ICU 1st-week Ct-values are subcategorised as <20, 20-30 and >30 the 28-day survival probability was less for patients with Ct-values of <20.
This report shows that the impact of Ct-values and outcomes, especially AKI, among patients at different time points prior to and during ICU stay, larger studies are required to confirm out findings.
Keywords: qPCR, Ct values PCR, COVID-19, SARS-CoV-2, intensive care.
INTRODUCTION
In December 2019, cases of pneumonia of an unknown aetiology were first reported to the World Health Organisation (WHO) from Wuhan in China. A novel coronavirus, termed Severe Acute Respiratory Syndrome Coronavirus-2 (SARS-CoV-2) was subsequently identified as causing the coronavirus disease 2019 (COVID-19) that become a global pandemic with multiple waves all over the world throughout 2020 and 2021. Overall mortality of COVID-19 patients in intensive care units (ICU) remains high, circa 40 per cent, almost twice that seen in ICU admissions with other viral pneumonias [1].
The gold standard for diagnosing SARS-CoV-2 infection is by using reverse transcription Real-Time polymerase chain reaction (qPCR) on a respiratory sample. Semi-quantitative detection of a genetic target by qPCR relies on the production of a fluorescent signal. The Cycle threshold (Ct) is defined as the number of heating and cooling cycles required for the fluorescent signal to cross the threshold (i.e. exceeds background level) and commence the production of an exponential curve. Ct values are semi-quantitative and can broadly categorise the concentration of viral genetic material in a sample. It is important to note that qPCR assay sensitivity varies widely, without the use of (ideally international) standards; Ct values are not comparable between different assays. Ct values are also impacted by sample type. Upper respiratory tract swabs, endotracheal aspirate and bronchoalveolar lavage samples are by nature unique and will differ significantly in their Ct values, even from the same patient when taken at the same time [2]. The assessment of the significance of changes in Ct value (for these non-standardised volume and/or highly variable sample types) must be limited to considering an overall trend using the same sample type. Ct values are inversely proportional to the amount of target nucleic acid in the sample, i.e. the lower the Ct value the greater the amount of target nucleic acid in the sample [3]. At the Southampton Specialist Virology Centre Ct >35 is considered to be the target detected at a low level, with progressively increasing concentration up to a maximum of ~ Ct 9 for SARS-CoV-2.
A number of studies have evaluated SARS-CoV-2 PCR Ct values as a surrogate marker for viral load over time and comparing populations. Viral load has been shown to be higher in patients over 60 and patients with severe COVID-19 [4-6]. Ct values increase with time from symptom onset indicating a reduction in the viral RNA load [7]. Additionally increased Ct values demonstrate less likelihood of viable virus with only 8.3% of samples with a Ct value >35 producing culturable virus with an 8% chance of culturable virus at >10 days from symptom onset in mild to moderate disease [8].
Despite those studies there is limited data on the impact of serial Ct values on outcomes in critically ill patients prior to their admission to ICU and during their ICU stay. Our main aim in this study was to determine the impact of serial SARS-CoV-2 RT PCR Ct values, both prior and during ICU stay, on: (A) Mortality, (B) the need for mechanical ventilation and (C) the development of acute kidney injury.
PATIENTS AND METHODS
A retrospective, single centre cohort study was performed among COVID-19 patients admitted to the General Intensive Care Unit (GICU) at the University Hospitals Southampton NHS Foundation Trust in the United Kingdom, between March 3rd and July 1st 2020.
Patients were tested for SARS-CoV-2 RNA at the Southampton Specialist Virology Centre. Combined mid-turbinate and throat swabs were placed into VIROCULT virus transport medium (Sigma). Swabs were extracted using MicrosensDx RapiPREP® nucleic acid extraction reagents and purified using magnetic particle extraction on the Thermo Scientific KingFisher Flex using the current standard operational procedures. All lower respiratory tract samples were extracted using the QIAsymphony SP and the QIAsymphony DSP Virus/Pathogen Mini Kit (both from Qiagen, Germantown, MD) according to the manufacturer’s recommendations. Amplification took place on Applied Biosystems (ABI) 7500s using the Viasure NCO2 SAR-CoV-2 RT-PCR kit (Prolabs, ORF1ab and N genes). Additionally, each sample was tested using an in-house World Health Organisation E Sarbecco gene assay (including an internal amplification control from extraction), to enhance sensitivity and prevent false negative results from being reported. The difference in method reflects the move from QIAsymphony to Kingfisher for respiratory swabs however; saliva and lower respiratory samples were still processed using the QiaSymphonySP. PCR was performed using the ABI 7500 no matter which extraction technology was used.
Patients initially provided an upper respiratory tract (combined mid-turbinate and throat) swab prior to GICU admission (Pre-ICU). Repeat samples were submitted at various time points during their ICU admission (1st week, 2nd week and 3rd week in ICU); the majority of these samples being endotracheal aspirates and sputum specimens. The patients had not been stratified by the inflammatory status at time of admission. However, all of them received standardized treatment.
Ct values were evaluated during the time points from pre-ICU admission to week 1, week 2 and week 3 during ICU stay. The E Sarbecco gene target was chosen to compare the Ct threshold values for each sample throughout the study. If a patient had multiple PCRs during the same time period, i.e. if a patient had two PCRs on the same day, the lowest Ct values of those were included for this evaluation.
At week 1 Ct values over time were evaluated for ICU outcomes including mortality, need for mechanical ventilation and development of acute kidney injury. Patients’ demographic, and laboratory data were extracted from electronic health records and all patients were followed up until their discharge from hospital or death, to ascertain outcome data. Symmetrically distributed variables were reported using the mean (standard deviation), whereas variables exhibiting a skewed distribution were reported using the median [first quartile – third quartile], with the Mann-Whitney U test being used to assess differences in continuous variables. Additionally, receiver operating characteristic curves (ROC) were performed for age, APACHE-II score, severity of hypoxia on admission defined as the PaO2/FiO2 ratio (kPa) and compared with ICU week 1 lowest Ct values. Furthermore Kaplan-Meir survival probability at day-30 according to the ICU Ct values at week-1 was performed.
This project was performed without any impact on patient care, as a quality improvement project (QIP) and was approved by the hospitals audit department, hence external ethics was not sought.
RESULTS
There were 93 COVID-19 PCR confirmed patients admitted to GICU during this period. There were procedural changes for the PCR came into place in April 2020, hence patients only who had tested with the new methodology included in this study. Hence, we were able to obtain Ct values during admission and within a week of admission to GICU for a total 76 patients. The ethnic groups of those admitted: White (N=44), Black (N=7) and Asians (N=22) and unknown/other (N=3). The detailed demographics of these patients are presented in Table 1.
Table 1 - Patient demographics and outcomes. APACHE- II; Acute Physiology and Chronic Health Evaluation II score, COPD; Chronic Obstructive Pulmonary Disease, ICU; Intensive Care Unit, SOFA; Sequential Organ Failure Assessment score.
|
Variable |
Total patients (N=76) |
|
Median Age (IQR) years |
60 (47,65) |
|
Male: Female |
1.4:1 |
|
Onset of symptoms (IQR) prior to admission to ICU in days |
7 (5,10) |
|
Days hospitalised prior to ICU admission |
0 (0,1) |
|
Comorbidities Diabetes mellitus, n (%) Asthma, n (%) COPD, n (%) Hypertension, n (%) Ischaemic heart disease, n (%) Congestive cardiac failure, n (%) Immunosuppression, n (%) |
20 (26,3%) 10 (13.1%) 2 (2.6%) 30 (39.5%) 7 (9.2%) 2 (2.6%) 12 (15.8%) |
|
ICU Severity Scores Median APACHE II (IQR) Median SOFA(IQR) Median PaO2/FiO2 ratio (kPa) (IQR) Approximated in-hospital mortality prediction |
14 (11,24) 4 (3,6) 15.3 (13.3,18.3) 15-20% |
|
Outcomes Non-invasive ventilation only, n (%) Mechanical ventilation, n (%) Acute kidney injury (any stage)* Length of ICU stay (days) Length of hospital stay (days) ICU survival n, (%) Hospital survival (%) |
28 (36.8%) 45 (59.2%) 34 (44.7%) 8.5 (3,21.2) 22.5 (11,37.5) 64 (84.2%) 63 (82.9%) |
*Acute kidney injury defined by the 2012 Kidney Disease: Improving Global Outcomes (KIDGO) at any time point during the ICU admission.
Figure 1A shows the lowest median value for the entire cohort during the time points from pre-ICU admission to week 1, week 2 and week 3 ICU stay. These were 27.7 (IQR 22.0, 28.3), 24.35 (IQR 20.4, 28.6), 29.6 (IQR 27.0,31.3), 31.2 (IQR 28.0, 34,5) respectively. The trend towards decrement in Ct values from pre-ICU to 1st week of ICU, however this was not statistically significant and likely reflects the different sample types, nose/throat swabs pre-ICU to predominantly endotracheal secretions. There was a continuous increment in Ct values over the ICU stay from week 1 through to week 3.
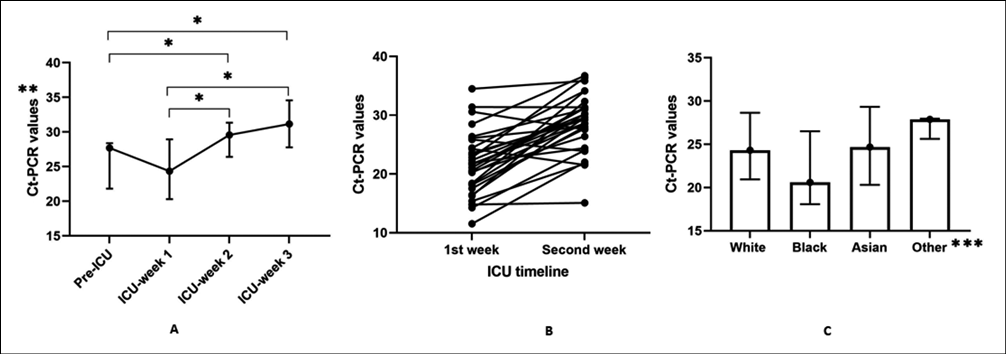
Figure 1 - A: Median lowest Ct-PCR values over the ICU admission timeline. Data presented as median and interquartile ranges. B: The variations between patients in the change of Ct values between ICU-1st week and ICU-2nd week. C: Median lowest ICU week-1 Ct values over different ethnicity in lower respiratory tract samples. The data is presented as median and interquartile ranges.
*p<0.05, ** Pre-ICU & during ICU Ct values are not comparable as the former are from Upper respiratory tract samples and the latter from Sputum and Endotracheal aspirates. In our experience we normally see a difference between 2 and 8 Cts between URTS and LRTS collected at the same time (unpublished data). ***Other: includes patients of unknown ethnic origin.
Furthermore, although there was a tendency for increment of Ct values over the ICU period, (Figure 1A), this was not true or consistent for all patients (Figure 1B). Where individuals had Ct values measured for both week one and two (N=30), we analysed the delta Ct value change for each individual as a percentage and this varied between patients and ranged between -11.2% to 98.6% from ICU week 1 measurements. Moreover, the ICU 1st week Ct values were lower among those of Black ethnicity, compared to other ethnic groups, again there was no statistical significance between groups; mean Ct was 24.3 for Caucasian (IQR 21.0, 28.6), 20.6 for Black (IQR 18.1, 26.5) and 24.7 for Asian (IQR 20.3, 29.3) patients (Figure 1C).
With regards to outcomes, although patients deceased (N=13) had lower Ct values (21.6 vs 24.5), compared to those survived, this was not statistically significant (p=0.1303). A similar lower Ct value was also noted for those requiring mechanical ventilation (23.3 vs 27.7), the difference not being statistically significant (p=0.0527). However, patients who had developed AKI at any stage of their illness (N=34) had significantly lower Ct values compared to those with normal renal function (N=42) (22.1 vs 26.2), p=0.0288 (Figure 2).

Figure 2 - The variations in ICU-week-1 Ct values for the ICU outcomes: mortality (A), the need for mechanical ventilation (B), and the development of acute kidney injury (C) and Ct values over time for these outcomes, mortality (D), need for mechanical ventilation (E) and development of AKI (F).
When performing receiver operating characteristic curves for age, APACHE-II score, severity of hypoxia on admission defined as the PaO2/FiO2 ratio (kPa) and compared with ICU week 1 lowest Ct values, the best performance in predicting mortality was achieved by the APACHE-II score (AUC 0.791, CI 0.611 to 0.910). Others had similar mortality predictive performance, age (AUC 0.662, CI 0.480 to 0.843), PaO2/FiO2 ratio (AUC 0.662, CI 0.480 to 0.844) and Ct (AUC 0.636, CI 0.453 to 0.819) (Figure 3). When ICU week-1 Ct values are sub-categorized as <20, 20-30 and >30 the 28-day survival probability was less for patients with CT-PCR values of <20 (Figure 4).

Figure 3 - The Receiver Operator Characteristics (ROC) for hospital mortality prediction.

Figure 4 - Kaplan-Meir survival probability at day-30 according to the ICU Ct values at week-1.
DISCUSSION
To our knowledge, this is the first report showing the impact of Ct values at different time points and outcomes in patients admitted to ICU during their ICU stay. The results suggest significant association between lower week 1 Ct values during ICU stay and the development of AKI at any stage. Additionally, more deaths and need for mechanical ventilation were observed when the Ct values were lower in week 1 and over time in ICU, however these were not statistically significant, potentially due to the relatively small sample size (Figure 2). Although non-significant, pre-ICU admission lower Ct values from the upper respiratory tract samples was also associated with worse outcome (figure 2 D, E and F).
Additionally, when ICU week-1 Ct values were subcategorised as <20, 20-30 and >30, the 28-day survival probability was lower for patients with Ct values of <20 during the first week in their ICU stay (Figure 4). Although mortality could have occurred due to other multiple variables including patients’ risk factors, comorbidities and the degree of inflammatory status, a Ct value <20 during the first week of ICU admission was associated with increased 30-day mortality. There was a trend towards lower Ct values among black ethnicity. This was not statistically significant, and our sample size is too small to make any further assumptions. However, to our knowledge these findings have not been previously reported and therefore, larger population studies are warranted to investigate this further. Development of AKI is a serious complication of COVID-19 critical illness and associated with significant mortality over and above the expected outcome. It appears lower Ct values at ICU presentation may have a predictive role in development of organ failures including acute kidney injury which warrants further evaluation.
Our findings contradict a small study included 23 COVID-19 patients that found no differences in the initial nor the nadir Ct values between survivors and non-survivors or mild/moderate versus severe/critical illness at the maximum point of illness [9]. But our results confirm findings from a systematic review data from 18 studies that concluded that lower Ct values may be significantly associated with worse outcomes and that Ct values may be useful in predicting the clinical course and prognosis of patients with COVID-19 [10].
The study has a number of limitations including the small number of patients, lack of information regarding days of symptoms preceding the first Ct detection, and the fact that this was a single centre study with a retrospective data collection design. Additionally, the Ct values are subject to inter-assay variations, as well as variation in relation to sample quality as previously mentioned. However, assay specific Ct value cut offs can be developed by diagnostic centres, by comparing their own clinical outcomes to their locally derived Ct values. The recent availability of the first WHO International Standard for SARS-CoV-2 RNA (NIBSC code: 20/146, IU/mL) will provide the opportunity to quantitate ETS/BAL samples to assess the potential further prognostic value of serial sampling to provide information about the trajectory or subsequent course of the illness or outcomes. Sputum, ETS and BAL samples are variable in their viscosity and dilution, it is imperative therefore to avoid inappropriate interpretation of changes in Ct values. Aliquots of the same sputum, ETS or BAL can give significant differences in Ct value, based upon the natural variation in the sample type. The variation in respiratory tract specimen Cts over time needs to be interpreted with caution and as one piece of the full clinical picture. Other limitations include using a mixture of upper and lower respiratory tract samples. Pre- ICU samples were always combined mid-turbinate and throat swabs whereas the majority of the intra ICU samples where endotracheal aspirates and sputum which provided a degree of consistency for the sample type in the ICU setting.
Due to the length of critical care admission, competing demand for ICU beds and high mortality, it is important to obtain evidence to improve appropriate and early escalation of patients with COVID-19. Therefore, despite the limitations with our study, we think our findings warrant further investigation as to whether patients with lower Ct values on admission are at-risk of organ failures and should be considered for admission to higher levels of care earlier during their hospital stay; particularly those with black ethnic background. Furthermore, predictors for intubation of patients on non-invasive ventilation with COVID-19 are an area of ongoing research, whether Ct values can be used as a surrogate marker for this, should also be investigated.
Acknowledgments
We thank microbiology, specialist virology and general intensive care unit staff as well as the audit department at University Hospitals Southampton NHS Foundation Trust for their continuous support.
Funding
This work was performed in authors own time, no additional funding was obtained for the work.
Conflicts of interest
Nothing to declare or disclose.
REFERENCES
[1] Armstrong RA, Kane AD, Cook TM. Outcomes from intensive care in patients with COVID-19: a systematic review and meta-analysis of observational studies. Anaesthesia. 2020; 75, 1340-9.
[2] Hamed I, Shaban N, Nassar M, Cayir D, Love S, Curran MD, et al. Paired nasopharyngeal and deep lung testing for SARS-CoV2 reveals a viral gradient in critically ill patients: A multi-centre study. MedRxiv. 2020. doi:10.1101/2020.07.19.20156869.
[3] Understanding cycle threshold (Ct) in SARS-CoV-2 RT-PCR A guide for health protection teams Understanding cycle threshold (Ct) in SARS-CoV-2 RT-PCR 2. n.d. Accessed on 02 Aug 2021 available via: https://assets.publishing.service.gov.uk/government/uploads/system/uploads/attachment_data/file/926410/Understanding_Cycle_Threshold__Ct__in_SARS-CoV-2_RT-PCR_.pdf
[4] Zheng S, Fan J, Yu F, et al. Viral load dynamics and disease severity in patients infected with SARS-CoV-2 in Zhejiang province, China, January-March 2020: Retrospective cohort study. BMJ. 2020; 369. doi:10.1136/bmj.m1443.
[5] Rao SN, Manissero D, Steele VR, Pareja J. A Narrative Systematic Review of the Clinical Utility of Cycle Threshold Values in the Context of COVID-19. Infect Dis Ther. 2020; 9, 573-86.
[6] Clementi N, Ferrarese R, Tonelli M, et al. Lower nasopharyngeal viral load during the latest phase of COVID-19 pandemic in a Northern Italy University Hospital. Clin Chem Lab Med. 2020; 58 (9), 1573-7.
[7] Bullard J, Dust K, Funk D, et al. Predicting Infectious Severe Acute Respiratory Syndrome Coronavirus 2 From Diagnostic Samples. Clin Infect Dis. 2020; 71 (10), 2663-6.
[8] Singanayagam A, Patel M, Charlett A, et al. Duration of infectiousness and correlation with RT-PCR cycle threshold values in cases of COVID-19, England, January to May 2020. Eurosurveillance. 2020; 25, 1. doi:10.2807/1560-7917. ES.2020.25.32.2001483.
[9] Camargo JF, Lin RY, Komanduri KV. Lack of correlation between the SARS-CoV-2 cycle threshold (Ct) value and clinical outcomes in patients with COVID-19. J Med Virol. 2021; 1- 4.
[10] Rao, SN, Manissero D, Steele VR, Pareja J. A Systematic Review of the Clinical Utility of Cycle Threshold Values in the Context of COVID-19. Infect Dis Ther. 2020; 9 (3), 573-86.